WEB ANALYTICS
This glossary outlines metrics and frameworks I use in Google Analytics (GA4) to assess web traffic, user actions and conversion success.
This glossary documents the diagnostic metrics I use to evaluate page speed, responsiveness, and UX via Google Lighthouse audits.
Original Looker Studio analytics dashboards were removed at the request of VisitGreenvilleSC to protect proprietary and confidential data.
The values here are illustrative and does not represent Riley Institute Looker Studio metrics. These dashboards were created using Microsoft Excel and Power BI to demonstrate my proficiency in Google Analytics (GA4), Looker Studio style reporting, and Wix data visualization tools.
GA4 Funnel
GA4 Traffic Sources: Sessions Breakdown by Channel

GA4 Engagement Rate + Avg. Engagement Time

1️⃣ Engagement rate is the percentage of “engaged sessions." A session is counted as engaged if any ONE of the following is true:
-
Session lasts 10 seconds or longer, OR
-
User triggers at least one conversion event, OR
-
User views 2 or more pages/screens
Engagement Rate =
Engaged ÷ Total Sessions
2️⃣ How is Engagement Time different from Session Duration?
METRIC
Session Duration
Engagement Time
WHAT'S MEASURED
Time between first and last hit
Time user is actively engaged
WHAT'S INCLUDED
Idle time
Only foreground time
WHY (NOT) GA4 USES IT
Easily inflated, misleading
Accurate attention time
To learn more about Google Analytics and Lighthouse terminologies, please refer to the glossaries above.
GA4 Conversion Behavior by Source

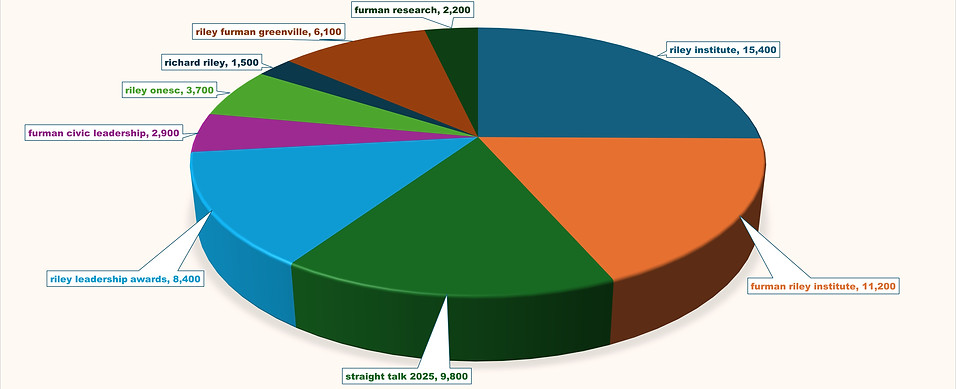
Top 10 Quarterly Search Queries
SEARCH QUERY
riley institute
furman riley institute
straight talk 2025
riley leadership awards
furman civic leadership
riley onesc
richard riley
riley furman greenville
furman research
IMPRESSIONS
15,400
11,200
9,800
8,400
2,900
3,700
1,500
6,100
2,200
CLICKS
2,180
1,640
1,240
680
970
860
780
710
130
CTR
14.20%
14.60%
12.70%
8.10%
33.40%
23.20%
52.00%
11.60%
5.90%
[by Impressions]
[by Clicks]

Website Design
No static mockups. These are real WordPress pages I've built. Explore how I use layout, hierarchy, and content strategy to elevate campaigns and drive real-life conversions.
