
My Impact with Numbers
This glossary documents the metrics and analytical frameworks I rely on to evaluate organic/paid social media and email campaigns.
The data below include Instagram and LinkedIn analytics for @RileyInstitute.
-
Baseline: August 4, 2025
In-depth reporting from Sprout Social and Meta Ads Manager is excluded due to data confidentiality.
These materials are curated to reflect my performance assessment and analytical methodology without exposing proprietary data.
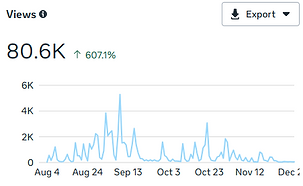
Instagram Views
Instagram Reach

Instagram Interactions

Instagram Views: Breakdown


Views (+607%) and interactions (+449%) skyrocketed despite a 15.8% decline in reach. This means higher engagement density per exposed user.
TL;DR: ⬇️reach +⬆️interactions = Engagement skewed to high-intent users.
Sustained growth in follower (+758%) and non-follower (+485%) views hint at improved content resonance across both existing and new audiences.
-
46% of views were from non-followers, reflecting strong algorithmic reach.
View peaks coincided with periods of high interactivity. This pattern aligns with Riley Institute's LinkedIn strategy: Leveraging a mix of promotional and educational content that resonates with relevant audiences to organically expand reach and nourish online visibility.
Overall, data shows improved efficiency across content funnel — converting exposure into interaction with a sustainable, targeted growth strategy.
LinkedIn Impressions

LinkedIn Clicks

Competitor Analysis

LinkedIn Engagement Rate

LinkedIn impressions spiked in early September, tied to Straight Talk 2025. Second lift came about in December as we kicked off Riley-Wilkins OneSC Awards promotion. Meanwhile, engagement rate peaked at 18.2% from ~5–6%, signaling improved message-audience fit. This drove downstream impact in conversions, as clicks rose by 596% versus impressions by 68%.
TL;DR: This campaign combined clear CTA, prestige signaling and time-bound participation.
Comments also increased significantly (+72%) despite the stability in reposts, crediting core audience engagement and exposure over share-driven virality.
Beyond event promotion, #RileyFellow posts powered engagement and retention; thought leadership sparked dialogue and mission alignment, while DLI content activated a smaller but targeted, engaged audience.
How Do I Assess Data-Driven Performance?
METRIC
Engagement per Impression
Engagement Rate
Clicks without Engagement
Click Through Rate (CTR)
Comments / Reactions Ratio
Post Half Life
Saves vs. Shares
Follower vs. Non-follower Views
INSIGHT
Content-Message Fit
Message-Audience Fit
Misaligned CTA
User Intent Strength ➡️ Optimize CTA Framing
Cognitive vs. Emotional Response
Content Durability
Saves vs. Shares
Retention health vs. discoverability